Tasuki Gap: Understanding Upside and Downside Patterns & AI Trading Integration
When it comes to reading stock charts, ever noticed those gaps that sometimes appear in prices? One such fascinating and useful pattern is the Tasuki Gap, which signals a likely continuation in market trends. Whether the market is soaring or plunging, these candlestick patterns help traders anticipate what’s next. Plus, in today’s world, artificial intelligence is revolutionizing how we analyze these patterns for smarter trading. Curious about how this all works?
What is the Tasuki Gap Pattern?
The Tasuki Gap is a candlestick chart pattern used in technical analysis to reveal that a market trend, either upward or downward, is likely to continue. It’s named after a Japanese word meaning “sash,” symbolizing the gap (space) between candles resembling a sash on the chart. This pattern involves three specific candles arranged to showcase a strong directional move with a small counter move that fails to undo the trend.
Imagine it like a train moving forward, briefly slowing but then continuing full steam ahead—the Tasuki Gap signals the trend will keep running.
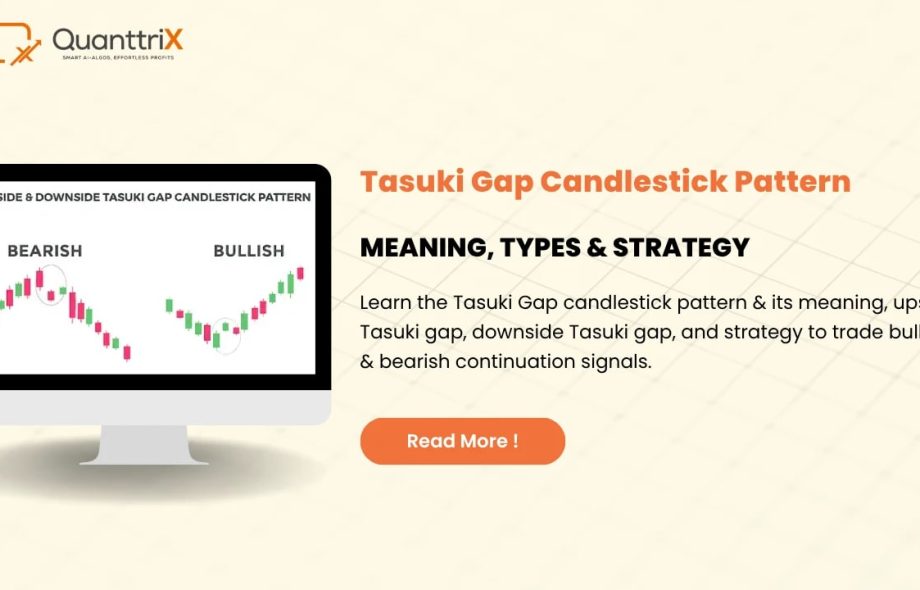
Explore downside tasuki gap candlestick pattern, upside tasuki gap, and the role of artificial intelligence for trading in market trends.
How Does the Tasuki Gap Form?
Tasuki Gap forms with three candles:
The first two have the same color and create a gap, showing strong momentum in one direction.
The third candle is opposite in color and tries to fill (or close) the gap but fails to do so entirely.
For the pattern to hold validity, the gap remains unclosed. This tiny pullback (third candle) looks like a brief pause before the trend resumes. A gap that is fully closed would mean the move is weakening.
Understanding the Upside Tasuki Gap
The upside Tasuki Gap is a bullish continuation pattern, appearing in rising markets. It starts with a big green candle that opens higher and closes strong. The next candle gaps up, confirming buyers’ control. The third candle is a small red candle pulling back into the gap zone but does not close it, hinting that buying pressure remains alive.
This is like a spring that gets pulled slightly back but still has enough force to launch forward again. When traders spot the upside Tasuki Gap, they expect the uptrend to keep pushing prices higher.
Exploring the Downside Tasuki Gap
Conversely, the downside Tasuki Gap is a bearish continuation pattern during a downtrend. It begins with a large red candle showing selling pressure, followed by another red candle opening lower, creating a downward gap. The third candle is a small green candle that tries to push prices back up but can’t fill the gap, signaling that sellers are still dominant.
Think of it like a ball rolling downhill, briefly hitting a bump but continuing its downward journey. This pattern warns that the selling may persist, so traders watch for further declines.
Comparing Upside vs. Downside Tasuki Gap
Feature
Upside Tasuki Gap
Downside Tasuki Gap
Trend Type
Bullish (Uptrend continuation)
Bearish (Downtrend continuation)
First Candle
Large green candle with strong close
Large red candle showing strong selling
Second Candle
Gaps up, also bullish
Gaps down, also bearish
Third Candle
Small red candle does not fill the gap
Small green candle fails to close the gap
Market Sentiment
Buyers are taking a short pause, then resume buying
Sellers dominate despite a brief buyer attempt
Signal Meaning
Uptrend likely to continue
Downtrend likely to continue
The Psychology Behind Tasuki Gaps
What really makes the Tasuki Gap special is the story it tells about market sentiment. The initial gap reflects strong enthusiasm in one direction, either buying or selling. The small counter candle represents a brief hesitation or profit booking but lacks enough power to stop the trend.
It’s like a tug-of-war where one side briefly loses grip but immediately regains strength, showing market dominance remains unchanged.
Importance of Tasuki Gap in Trading
For traders, Tasuki Gap patterns are handy tools confirming ongoing trends. They help answer questions like:
Is the current trend just resting, or about to change?
Should I enter a trade riding the trend or prepare for reversal?
Using these patterns can improve timing for trade entries or exits, increasing chances of profit while managing risks.
Limitations and Risks of Tasuki Patterns
While useful, Tasuki Gaps aren’t foolproof:
They work best in well-defined trends, not sideways markets.
Sometimes the gap can be misleading if external events cause sudden price movements.
These patterns should be combined with volume analysis and other indicators for confirmation.
Remember, no trading pattern guarantees success.
How to Identify Tasuki Gap in Charts
To spot Tasuki Gap:
Look for three candles in sequence—first two are the same color with a gap between their bodies.
The third candle moves opposite but doesn’t close the gap.
Use candlestick chart types on your trading platform with relevant timeframe (daily or weekly work best).
Some platforms highlight this pattern automatically with pattern recognition tools, making it easier for beginners.
Using Tasuki Gap for Better Trade Entries
When traders identify an upside or downside Tasuki Gap:
They consider entering trades in the direction of the gap.
They set stop-loss near the gap to limit potential losses if the trend reverses.
They watch for volume to support the pattern’s strength—higher volume means stronger signals.
This balanced approach helps combine technical insight with risk control.
Artificial Intelligence for Trading
Artificial intelligence (AI) uses computer algorithms to analyze vast market data, spotting patterns like Tasuki Gaps faster and with less human bias. AI trading systems learn from historical data to predict price moves and execute trades automatically.
By leveraging machine learning and deep neural networks, AI can identify subtle signals that human traders might miss, improving decision-making speed and accuracy.
Integrating AI with Tasuki Gap Analysis
AI-powered tools can scan thousands of assets looking for Tasuki Gap patterns in real time. They can:
Confirm the pattern’s validity by cross-checking with volume, volatility, and other technical indicators.
Predict how likely the trend continuation will hold based on past similar occurrences.
Recommend optimized entry and exit points based on risk assessments.
This technology takes traditional candlestick strategy like Tasuki Gap to a new high-tech level.
Benefits of AI in Trading Decisions
Speed: Instantly processes huge data volumes, faster than manual analysis.
Accuracy: Reduces emotional bias, sticking strictly to data-driven signals.
Efficiency: Frees traders from repetitive monitoring tasks.
Adaptability: Algorithms learn continuously from new market conditions, improving predictions.
Portfolio Management: AI optimizes risk by analyzing multiple assets and diversifying accordingly.
Challenges of AI in Trading
Requires vast quality data for training.
Market anomalies can confuse AI systems.
Over-reliance might ignore human intuition.
Costs and complexity of setup can be high.
Still, AI complements rather than replaces experienced traders.
Future of AI and Candlestick Patterns
The future promises more integration of AI analyzing candlestick patterns like Tasuki Gap. Increased computing power and advanced algorithms will allow personalized trading strategies adapting in real-time. Combined with human insight, this synergy could revolutionize financial markets.
Conclusion
The Tasuki Gap candlestick pattern—whether upside or downside—is a powerful signal that markets tend to keep moving in their current direction after a brief pause. It’s like a gentle nudge from the market confirming the trend’s strength. For traders and investors, recognizing these patterns can be a valuable addition to their toolkit.
By weaving artificial intelligence into this classic method, trading becomes smarter, faster, and less emotional. AI’s capability to spot patterns like the Tasuki Gap on vast data sets is transforming the way we trade today and will shape the markets of tomorrow. So next time you see a gap on your chart, remember: it might just be the market telling you where it’s headed next!
FAQs
1. What is the difference between upside and downside Tasuki gap?
Upside Tasuki Gap is a bullish pattern signaling an uptrend continuation, while downside Tasuki Gap is bearish, indicating a continuing downtrend.
2. Can Tasuki Gaps predict market reversals?
No, Tasuki Gaps primarily signal trend continuation, not reversals. For reversals, other patterns are needed.
3. How reliable is the downside Tasuki Gap pattern in trading?
It’s considered reliable in strong downtrends but should be confirmed with volume and other indicators for accuracy.
4. How does artificial intelligence improve trading with Tasuki Gap patterns?
AI increases speed and precision in detecting Tasuki Gaps across markets and suggests optimal trades by analyzing vast data beyond human capacity.
5. Can beginners use Tasuki Gap patterns effectively?
Yes, but beginners should combine Tasuki Gap signals with other analysis tools and risk management practices for better results.
 :
https://in.pinterest.com/
:
https://in.pinterest.com/